 An official website of the United States Government

Sorry, Internet Explorer is not supported.
Please switch to a modern browser like Google Chrome, Firefox, or Microsoft Edge to access FIM.

Flood Inundation Mapper
Uncertainties and Limitations for Use of Flood-Inundation Maps
Although the flood-inundation maps represent the boundaries of inundated areas with a distinct line, some uncertainty is associated with these maps. The flood boundaries shown were estimated based on water-surface elevations and streamflows at selected USGS streamgages. Water-surface elevations along the stream reaches were estimated by steady-state hydraulic modeling, assuming unobstructed flow, and using streamflows and hydrologic conditions anticipated at the USGS streamgage(s). Unique meteorological factors (timing and distribution of precipitation) may cause actual streamflows along the modeled reach to vary from those assumed during a flood, which may lead to deviations in the water-surface elevations and inundation boundaries shown. Additional areas may be flooded due to unanticipated conditions such as: changes in the streambed elevation or roughness, backwater into major tributaries along a main stem river, or backwater from localized debris or ice jams. The accuracy of the floodwater extent portrayed on these maps will vary with the accuracy of the digital elevation model used to simulate the land surface. Additional uncertainties and limitations pertinent to this study are described in the document accompanying this set of flood inundation map plates.
If this series of flood-inundation maps will be used in conjunction with National Weather Service (NWS) river forecasts, the user should be aware of additional uncertainties that may be inherent or factored into NWS forecast procedures. The NWS uses forecast models to estimate the quantity and timing of water flowing through selected stream reaches in the United States. These forecast models (1) estimate the amount of runoff generated by precipitation and snowmelt, (2) simulate the movement of floodwater as it proceeds downstream, and (3) predict the flow and stage (water-surface elevation) for the stream at a given location (National Water Prediction Service forecast point) throughout the forecast period which is typically every 6 hours and 3 to 5 days out in many locations. For more information on NWS NWPS forecasts can be found here: National Water Prediction Service - NOAA
Flood inundation map services can be found here.
More information about the Flood Inundation Mapping Program can be found here.
Version 2.14
Disclaimer for Flood-Inundation Maps
Inundated areas shown should not be used for navigation, regulatory, permitting, or other legal purposes. Although USGS intends to make this server available 24 hours a day, 7 days a week, timely delivery of data and products from this server through the Internet is not guaranteed. The USGS provides these maps “as-is” for a quick reference, emergency planning tool but assumes no legal liability or responsibility resulting from the use of this information.
USGS Data Disclaimer
Unless otherwise stated, all data, metadata and related materials are considered to satisfy the quality standards relative to the purpose for which the data were collected. Although these data and associated metadata have been reviewed for accuracy and completeness and approved for release by the U.S. Geological Survey (USGS), no warranty expressed or implied is made regarding the display or utility of the data for other purposes, nor on all computer systems, nor shall the act of distribution constitute any such warranty.
USGS Software Disclaimer
This software has been approved for release by the U.S. Geological Survey (USGS). Although the software has been subjected to rigorous review, the USGS reserves the right to update the software as needed pursuant to further analysis and review. No warranty, expressed or implied, is made by the USGS or the U.S. Government as to the functionality of the software and related material nor shall the fact of release constitute any such warranty. Furthermore, the software is released on condition that neither the USGS nor the U.S. Government shall be held liable for any damages resulting from its authorized or unauthorized use.
USGS Product Names Disclaimer
Any use of trade, firm, or product names is for descriptive purposes only and does not imply endorsement by the U.S. Government.
This web application has been made possible by the following projects:
Highcharts
Lobipanel
Bootstrap Select
Map Interface User Guide
Find Location/SearchWhen available, this button allows the user to search for a location such as a city, state, zip code, or general place name.
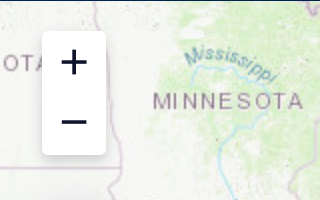
ZoomingThe scroll wheel on the mouse can be used to control zooming. In the upper left area of the map interface are "+" and "-" icons; these can also be used to zoom in and out, respectively.
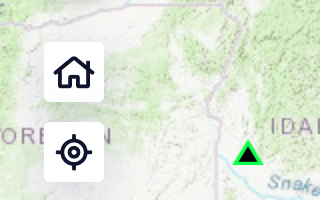
Home ButtonThe "Default extent" (Home icon) button will center the US on the map interface. The "Find my location" (Crosshair icon) button will zoom the map interface to your current location.
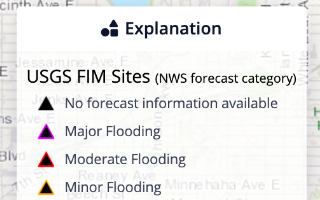
Explanation displayThe Explanation box can be collapsed to display more of the mapped area.
Using the ExplanationThe expanded Explanation box explains the symbols, patterns, and colors of the visible data layers on the map.
Mobile SidebarOn mobile devices, additional basemap and map layer selection option can be accessed by clicking on the 3-line icon which is shown in the most upper left corner of the map interface.
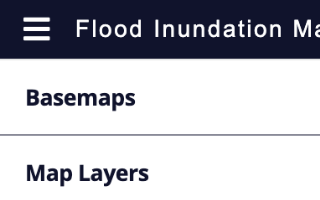
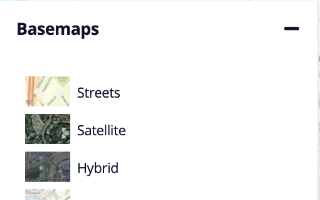
BasemapsThe "Basemaps" sidebar allows a user to choose and show various geographic information or landscape imagery as a background layer beneath the flood map layers.
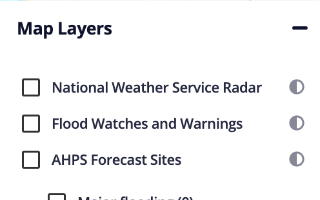
Map LayersThe "Map Layers" sidebar allows a user to choose and show additional map layers that are available from National Weather Service.
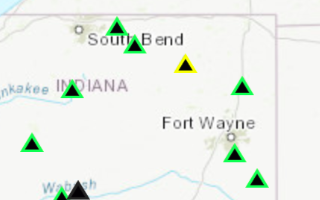
Selecting a SiteA user can select a site by clicking on any of the triangle symbols on the map interface. When a site is selected, a separate window will pop-up; this window will have several tabs with additional information about the site.
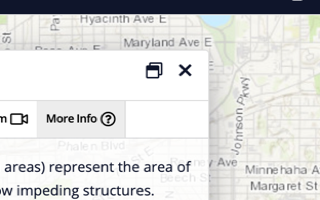
Managing Flood Tools PopupThe Flood Tools pop-up window can be moved by clicking the title area and dragging the window. The window can be minimized by clicking the 'collapse' icon. It can be expanded once again with the 'expand' icon. The flood tools can be closed by clicking the 'X' icon.
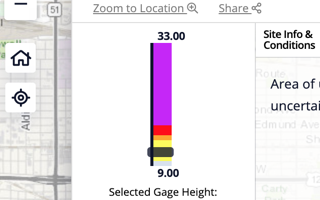
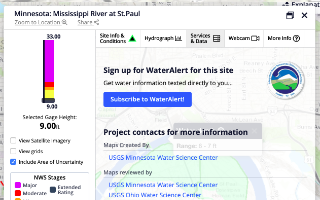
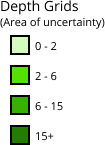
Gage Height SliderThe Gage Height Slider allows the user to select a gage height and see corresponding flood extent and related information. Selecting 'View grids' will color code the inundated area, with values given in explanation. Selecting 'View Satellite Imagery" will toggle the basemap to Satellite Imagery.
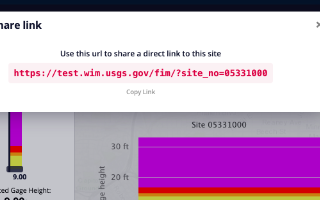
Sharing Site URLAt the end of the site name on the initial popup window, there is a link called "Share". When clicked, another popup window displays a site link URL which can be shared and used to browse directly to that particular site. This URL can be copied either by manually selecting the text or by clicking on the "Copy Link" button.
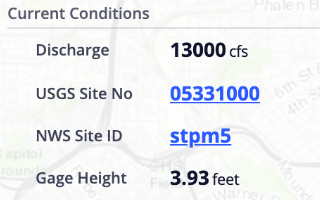
Site info & ConditionsThis section shows current conditions at the streamgage(s) as well as the selected conditions based on the setting of the Gage Height Slider(s).
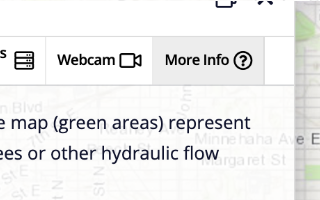
More Info TabDisplays optional additional information applicable for this site.
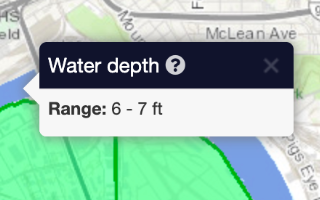
Water DepthClick in the inundated area to display estimated water depths.
HydrographDisplays the observed and predicted gage height/stage data. Click/Tap on the hydrograph to adjust the Gage Height Slider.
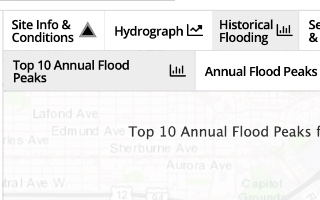
Historic Flood InformationDisplays annual flood peak information chronologically arranged on two charts. Top 10 Annual Flood Peaks shows the highest 10 annual flood peaks on record for the gage. Annual Flood Peaks shows the full record of annual flood peaks for the gage. Switch between the charts by selecting the associated tab at the top of the chart. Select a peak within the chart to adjust the selected gage height slider to the closest matching value to that peak.
Services & DataThe "Service and Data" tab includes access to study documentation and GIS data layers. Users can also sign up to receive text or email from the USGS when waters are rising in rivers and streams through WaterAlert. Users can use the flood inundation maps to determine what WaterAlert threshold to sign up for based on how flood levels will impact their area.
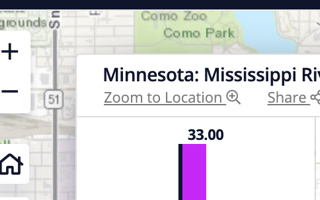
Zoom to LocationSelecting 'Zoom to location' will fit the interactive map window to display the extent of the flood library selected.


Get notifications for changes in water conditions based on thresholds

Latitude y | Longitude x (center)